OpenClaw browser tool timeout fix: complete production playbook
Problem statement: your team runs browser(action="status") and gets
Can't reach the OpenClaw browser control service (timed out after 15000ms), while
openclaw browser status from terminal still works. This mismatch is high-friction because it looks
like “network instability,” but the real root cause is often tool routing, target resolution, or a
version regression.
- GitHub issue #32814 (created 2026-03-03) reports browser tool timeout with specific root-cause hypothesis in URL resolution path.
- Pattern matches recurring operator pain: “CLI healthy, embedded tool broken,” which blocks browser automation onboarding.
Why this incident hurts more than it looks
Browser automation is usually the moment OpenClaw moves from “interesting” to “operationally valuable.” When browser tools fail, teams lose confidence in the stack and overcorrect with random reinstalls. That approach creates two problems: (1) you burn evidence needed for root cause and (2) you widen drift between machines. A calm, layered diagnostic flow is faster than heroic debugging.
Root-cause map: what can produce this timeout
- Target mismatch: runtime expects
target: "host"but resolves sandbox or empty base URL. - Control-port mismatch: browser control service runs, but tool points to stale/incorrect port.
- Regression in URL resolver: a code path returns undefined/empty base URL only in embedded execution.
- Mixed auth assumptions: CLI picks local auth context, tool layer uses different headers or policy.
- Proxy/tunnel over-layering: host profile works locally but fails through extra forward/rewrite hops.
10-step diagnosis runbook
1) Lock the incident context before changing anything
- Record OpenClaw version, OS, Node runtime, install method, and current config hash.
- Capture exact failing call and exact timeout string.
- Store gateway logs from one clean reproduction cycle.
2) Validate baseline service health
Confirm gateway and browser services are running. If CLI browser status works, note that as evidence that transport is likely healthy. Do not conclude incident is solved.
3) Compare execution paths: CLI vs embedded tool
The key question is not “does browser service respond?” but “does the embedded tool resolve the same base URL, target, and auth assumptions?” Any mismatch here is enough to produce 15s tool timeouts.
4) Force explicit target selection
In tool calls, use explicit target and avoid inferred defaults during triage. If host path succeeds and sandbox fails, you have isolated the failing boundary.
5) Eliminate proxy layers temporarily
Remove SSH tunnels, reverse proxies, and relay indirection for one controlled test. You need a known-good local baseline before adding complexity back.
6) Inspect resolver behavior
The fresh report in issue #32814 points to a missing return path in host URL resolution. Even if upstream details evolve, the operator lesson stays the same: inspect the function/path that converts config into control-service URL.
7) Check version-specific regressions
Reproduce on one prior known-good version. If the timeout disappears, pin temporarily and stop bleeding. Regression confirmation is more valuable than speculative patching.
8) Validate extension/relay assumptions
- Relay badge attached on the same tab you test.
- No stale tabs from old sessions.
- No conflicting profile assumptions between host and chrome targets.
9) Test with clean browser profile
A clean profile removes extension collisions and stale local state. It is one of the highest-signal checks with minimal risk.
10) Confirm closure with a deterministic acceptance test
“No timeout once” is not closure. Run 10 consecutive browser tool status checks and one real interaction (open page, snapshot, click). If all pass, incident is closed.
Practical fixes you can apply today
- Pin and verify: pin to a known-good version if regression suspected.
- Make target explicit: avoid implicit host/sandbox fallback in production scripts.
- Reduce moving parts: direct local path first, then reintroduce proxy layers with tests.
- Add preflight checks: run browser status in health checks before critical automations.
- Centralize runtime config: avoid conflicting configs across shell profile, service file, and JSON.
Edge cases most teams miss
- Port already bound by stale process: service appears up, but wrong process owns expected port.
- Mixed Node versions: gateway and CLI launched from different Node runtimes.
- Background daemon stale env: service started before config change and never reloaded.
- Cross-machine assumptions: copied config from another host with different security mode.
- “Works on terminal” trap: interactive shell env differs from daemon env.
Verification checklist
- 10/10 consecutive tool status calls pass within normal latency.
- One end-to-end browser workflow executes successfully.
- No unresolved timeout errors in gateway logs over 30 minutes.
- Config snapshot committed/documented for reproducibility.
- Runbook updated so the next incident resolves faster.
Typical mistakes that prolong outages
- Reinstalling immediately and destroying diagnostic evidence.
- Changing multiple variables at once (version + config + proxy).
- Assuming CLI success equals tool-path success.
- Ignoring regression windows and release notes.
- Skipping final acceptance tests after “apparent fix.”
Decision point: fix and self-maintain vs move to managed reliability
If browser-tool incidents are rare and your team enjoys infrastructure ownership, self-hosting remains viable. But if these failures repeatedly block delivery, your total cost is not server price—it is engineer interruption, slow incident response, and launch risk.
Start with a sober comparison on /compare/. If you want production-grade managed runtime, see /openclaw-cloud-hosting/. If you still prefer self-managed deployment, use the baseline guide at /openclaw-setup/ and layer this runbook on top.
Fix once. Stop recurring browser tool timeout incidents.
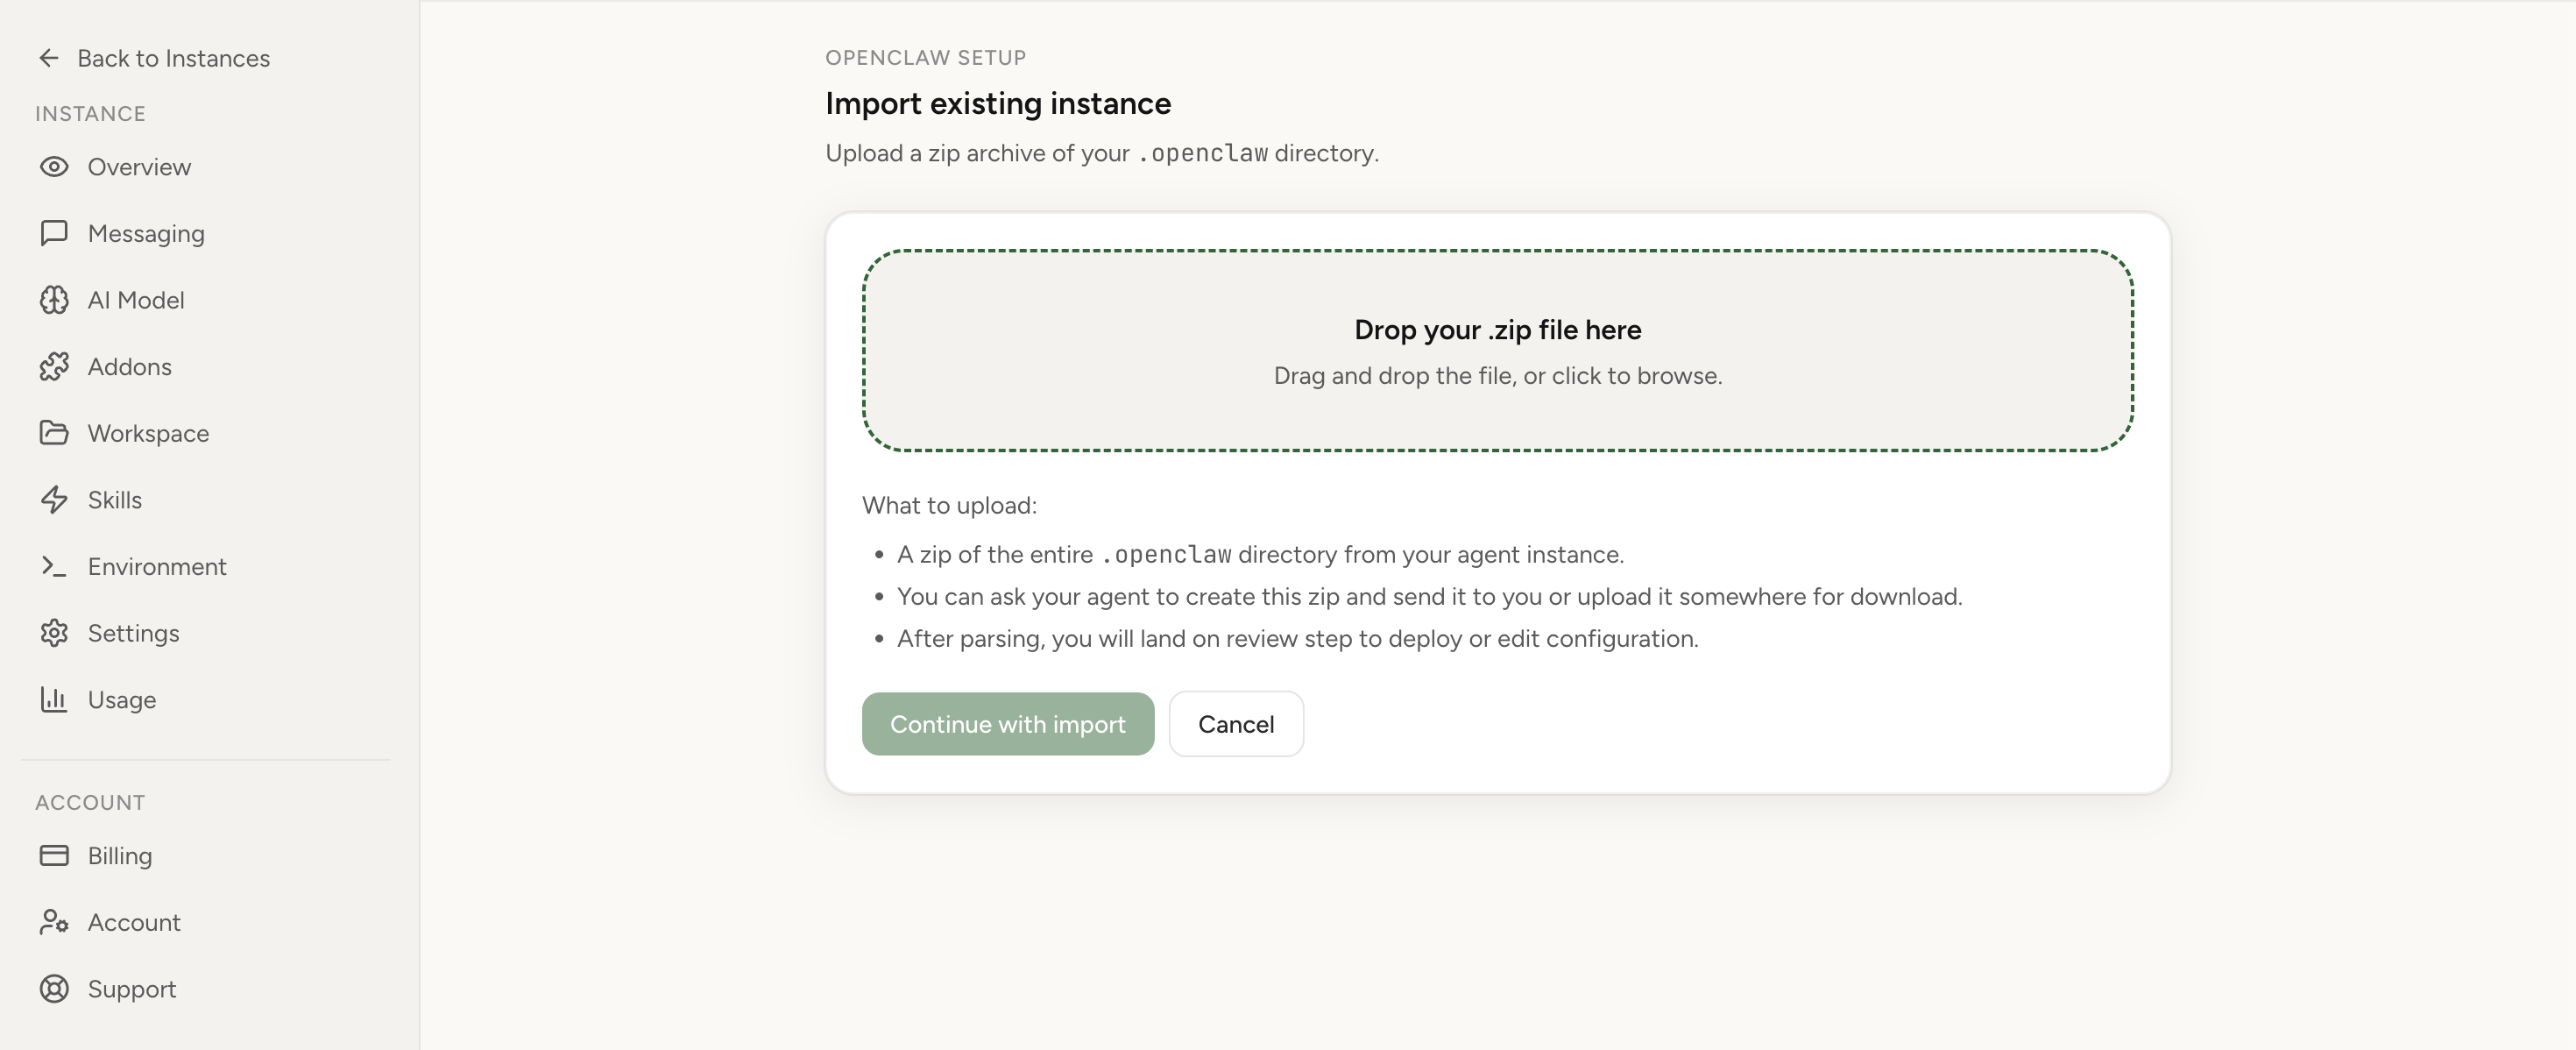
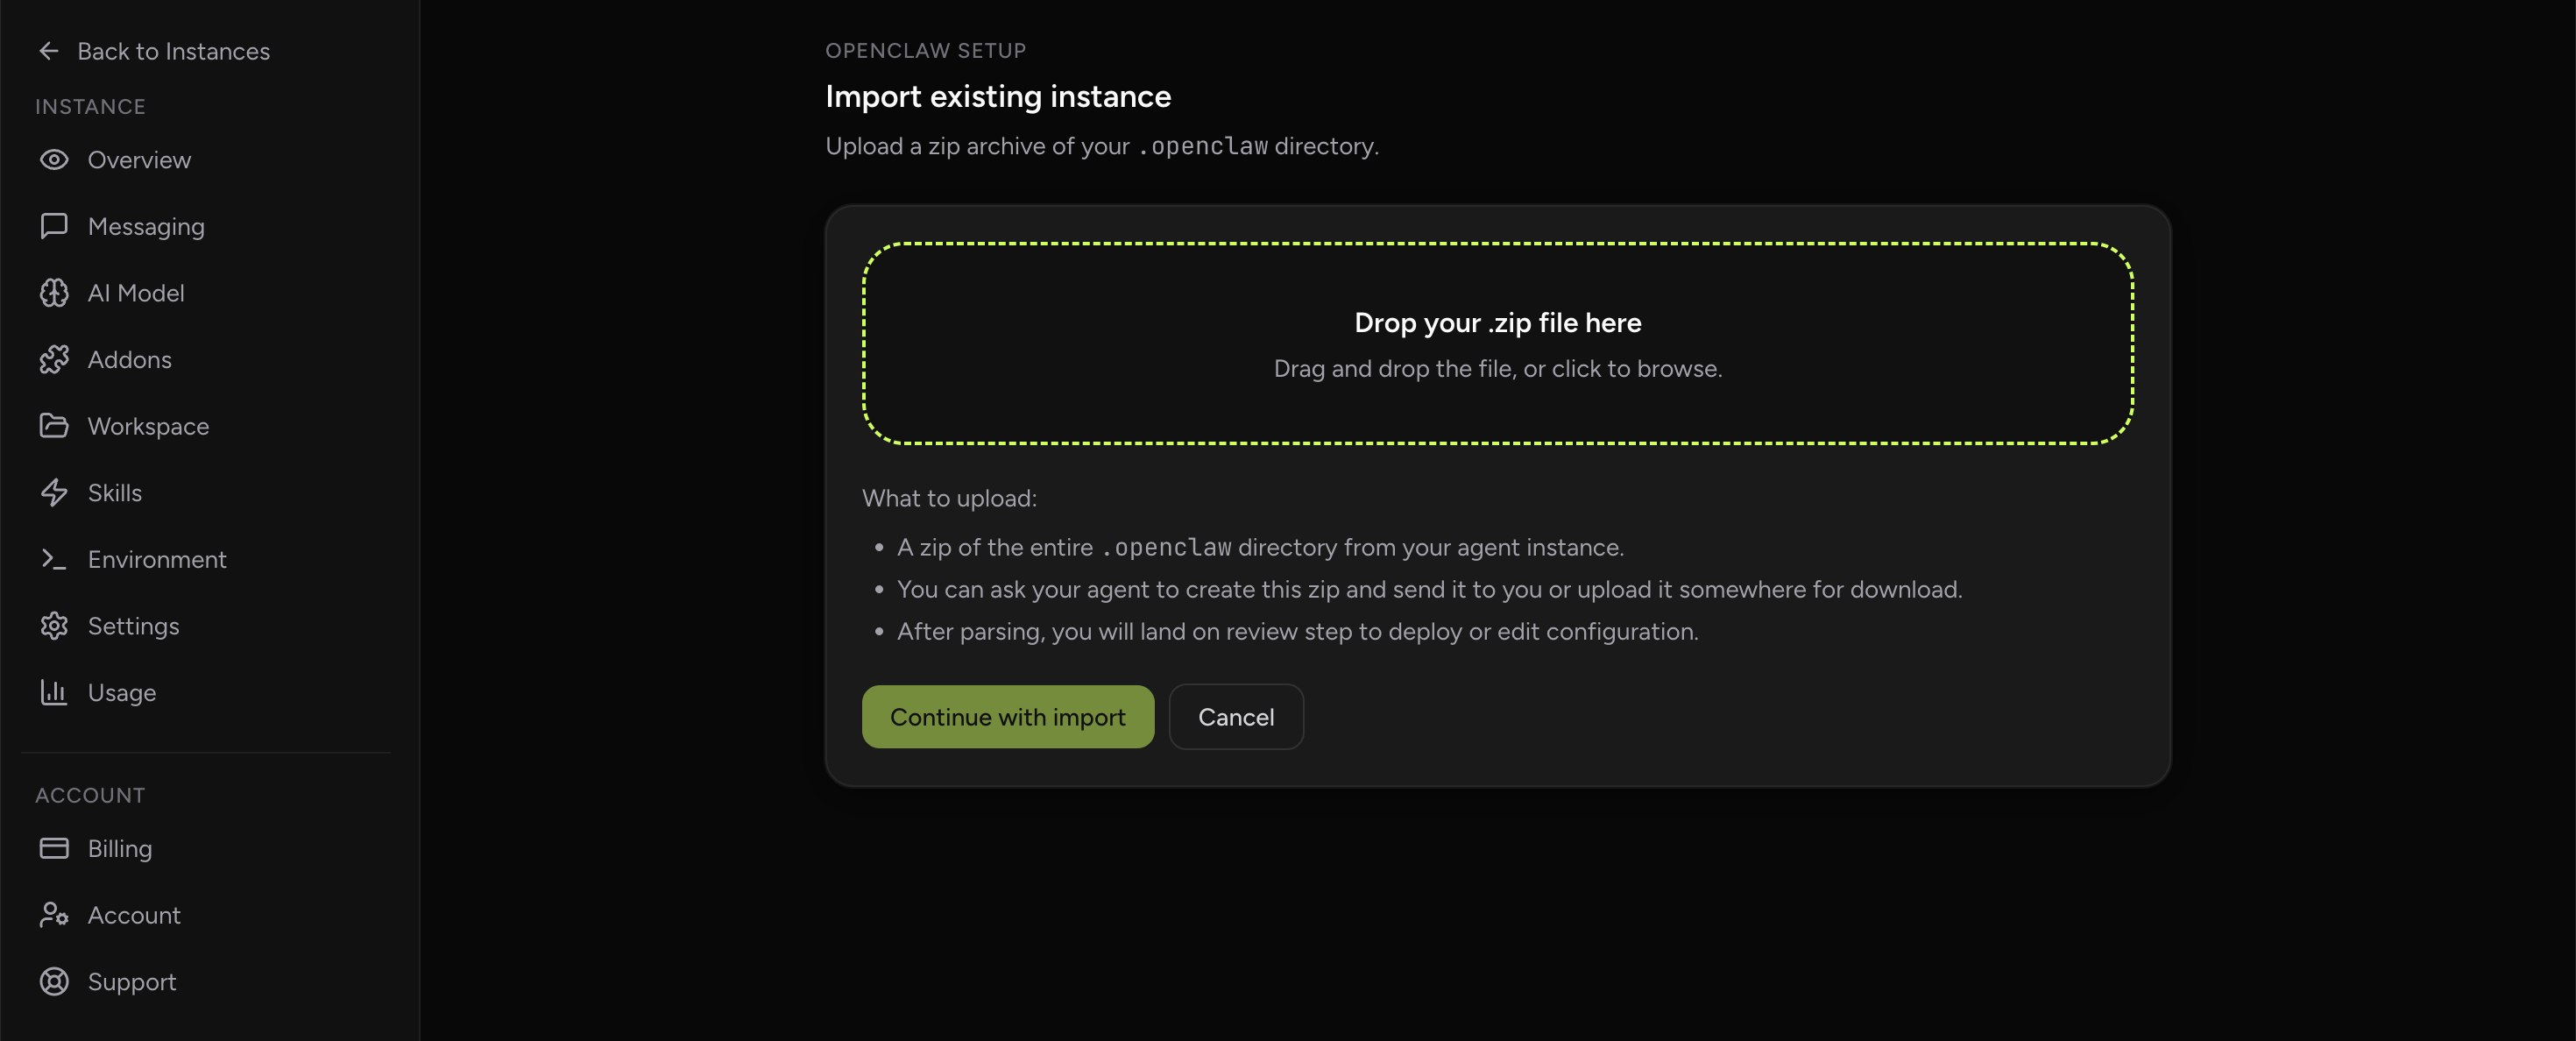
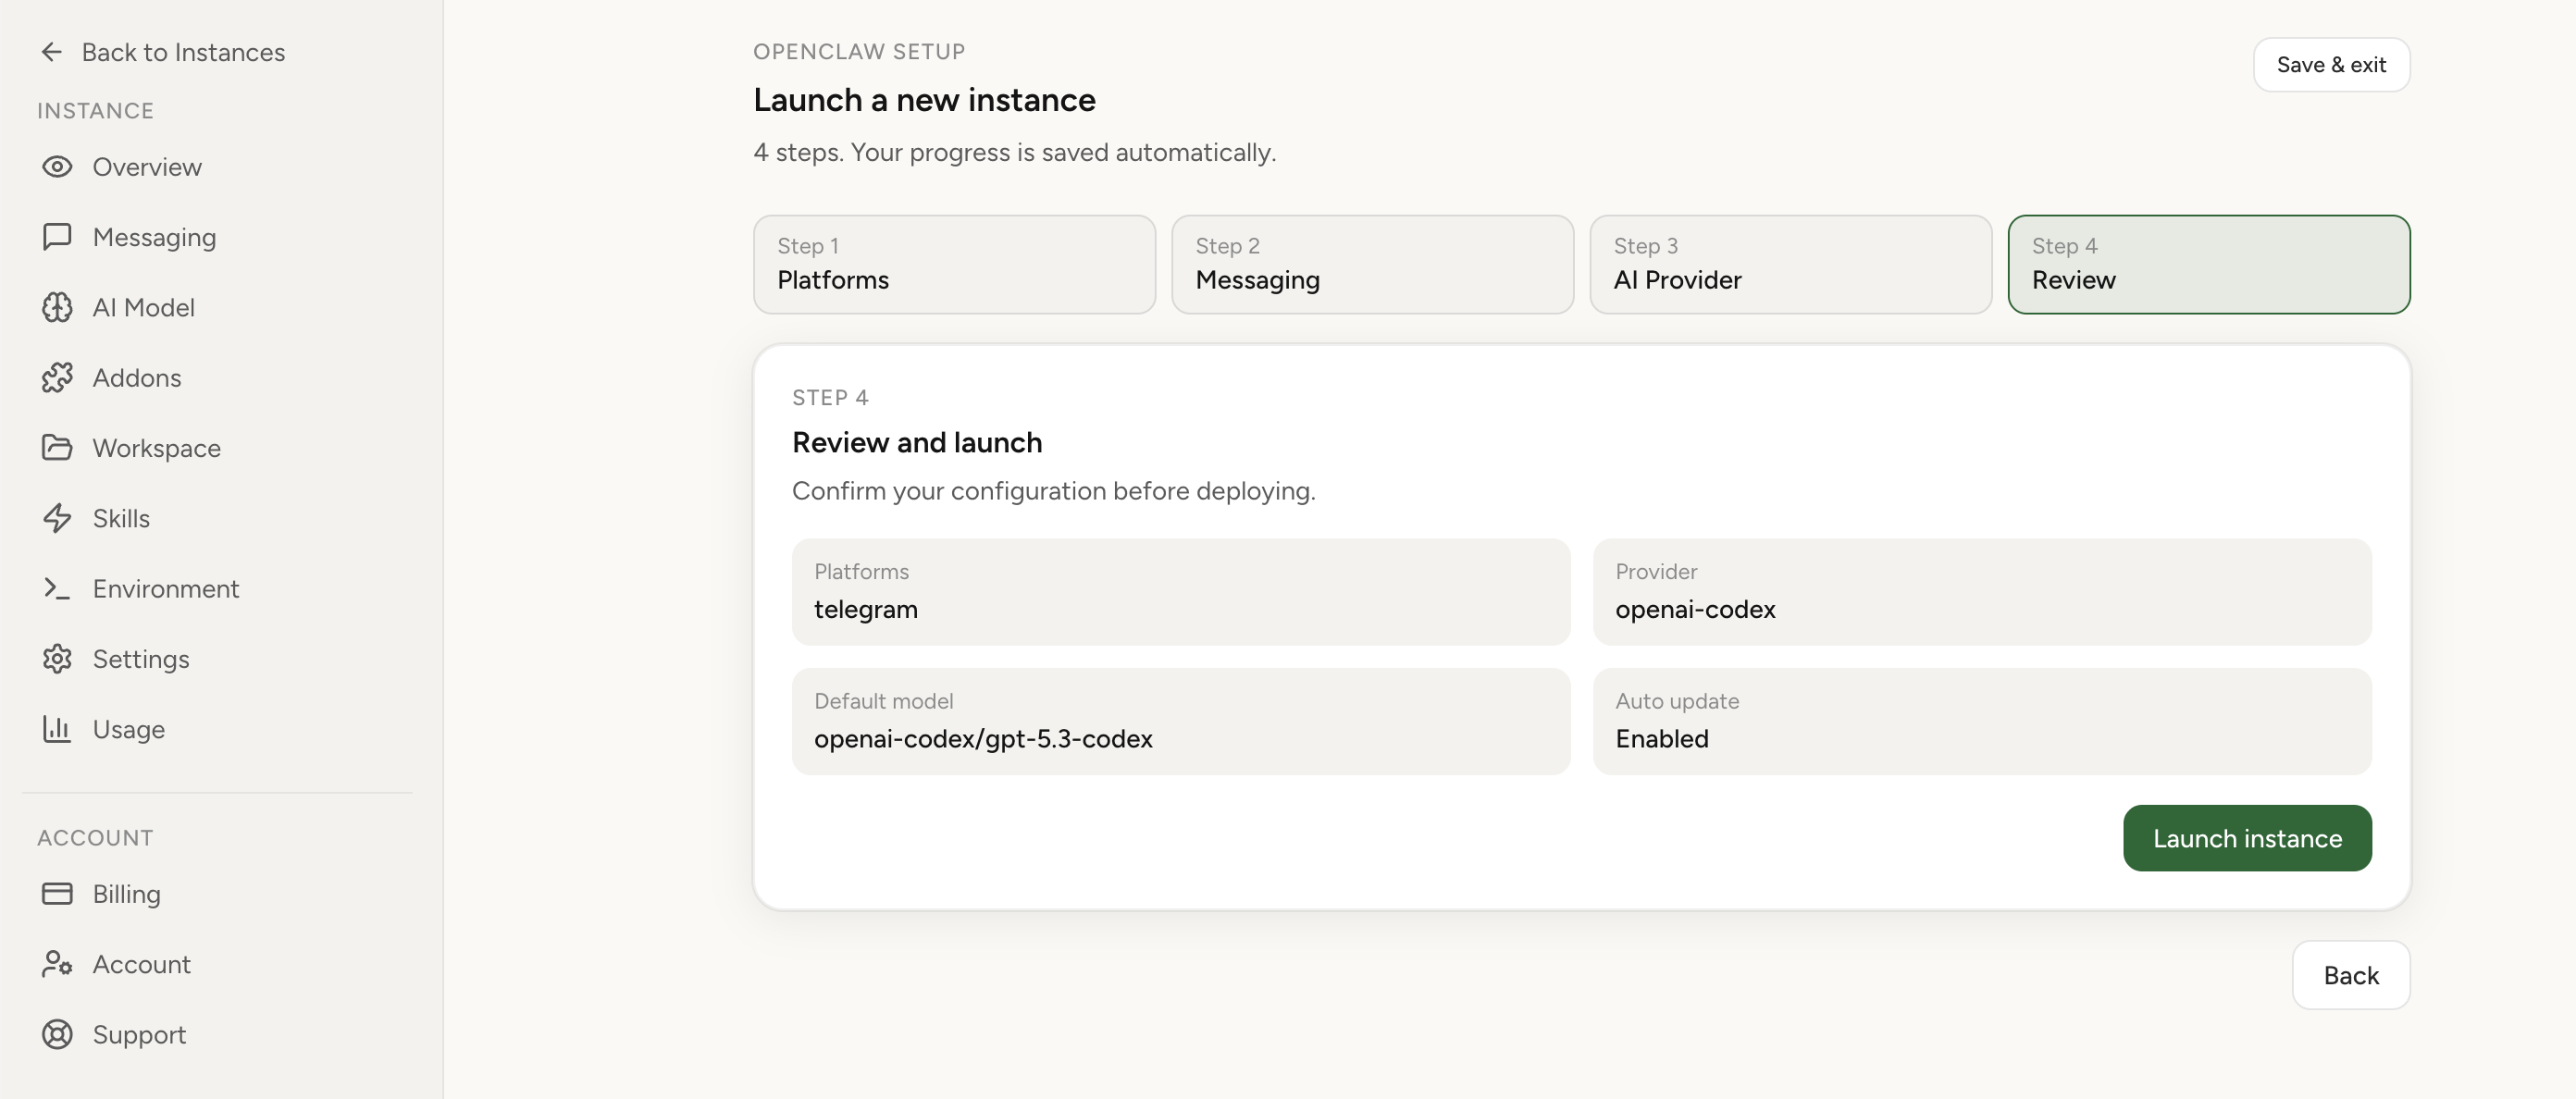
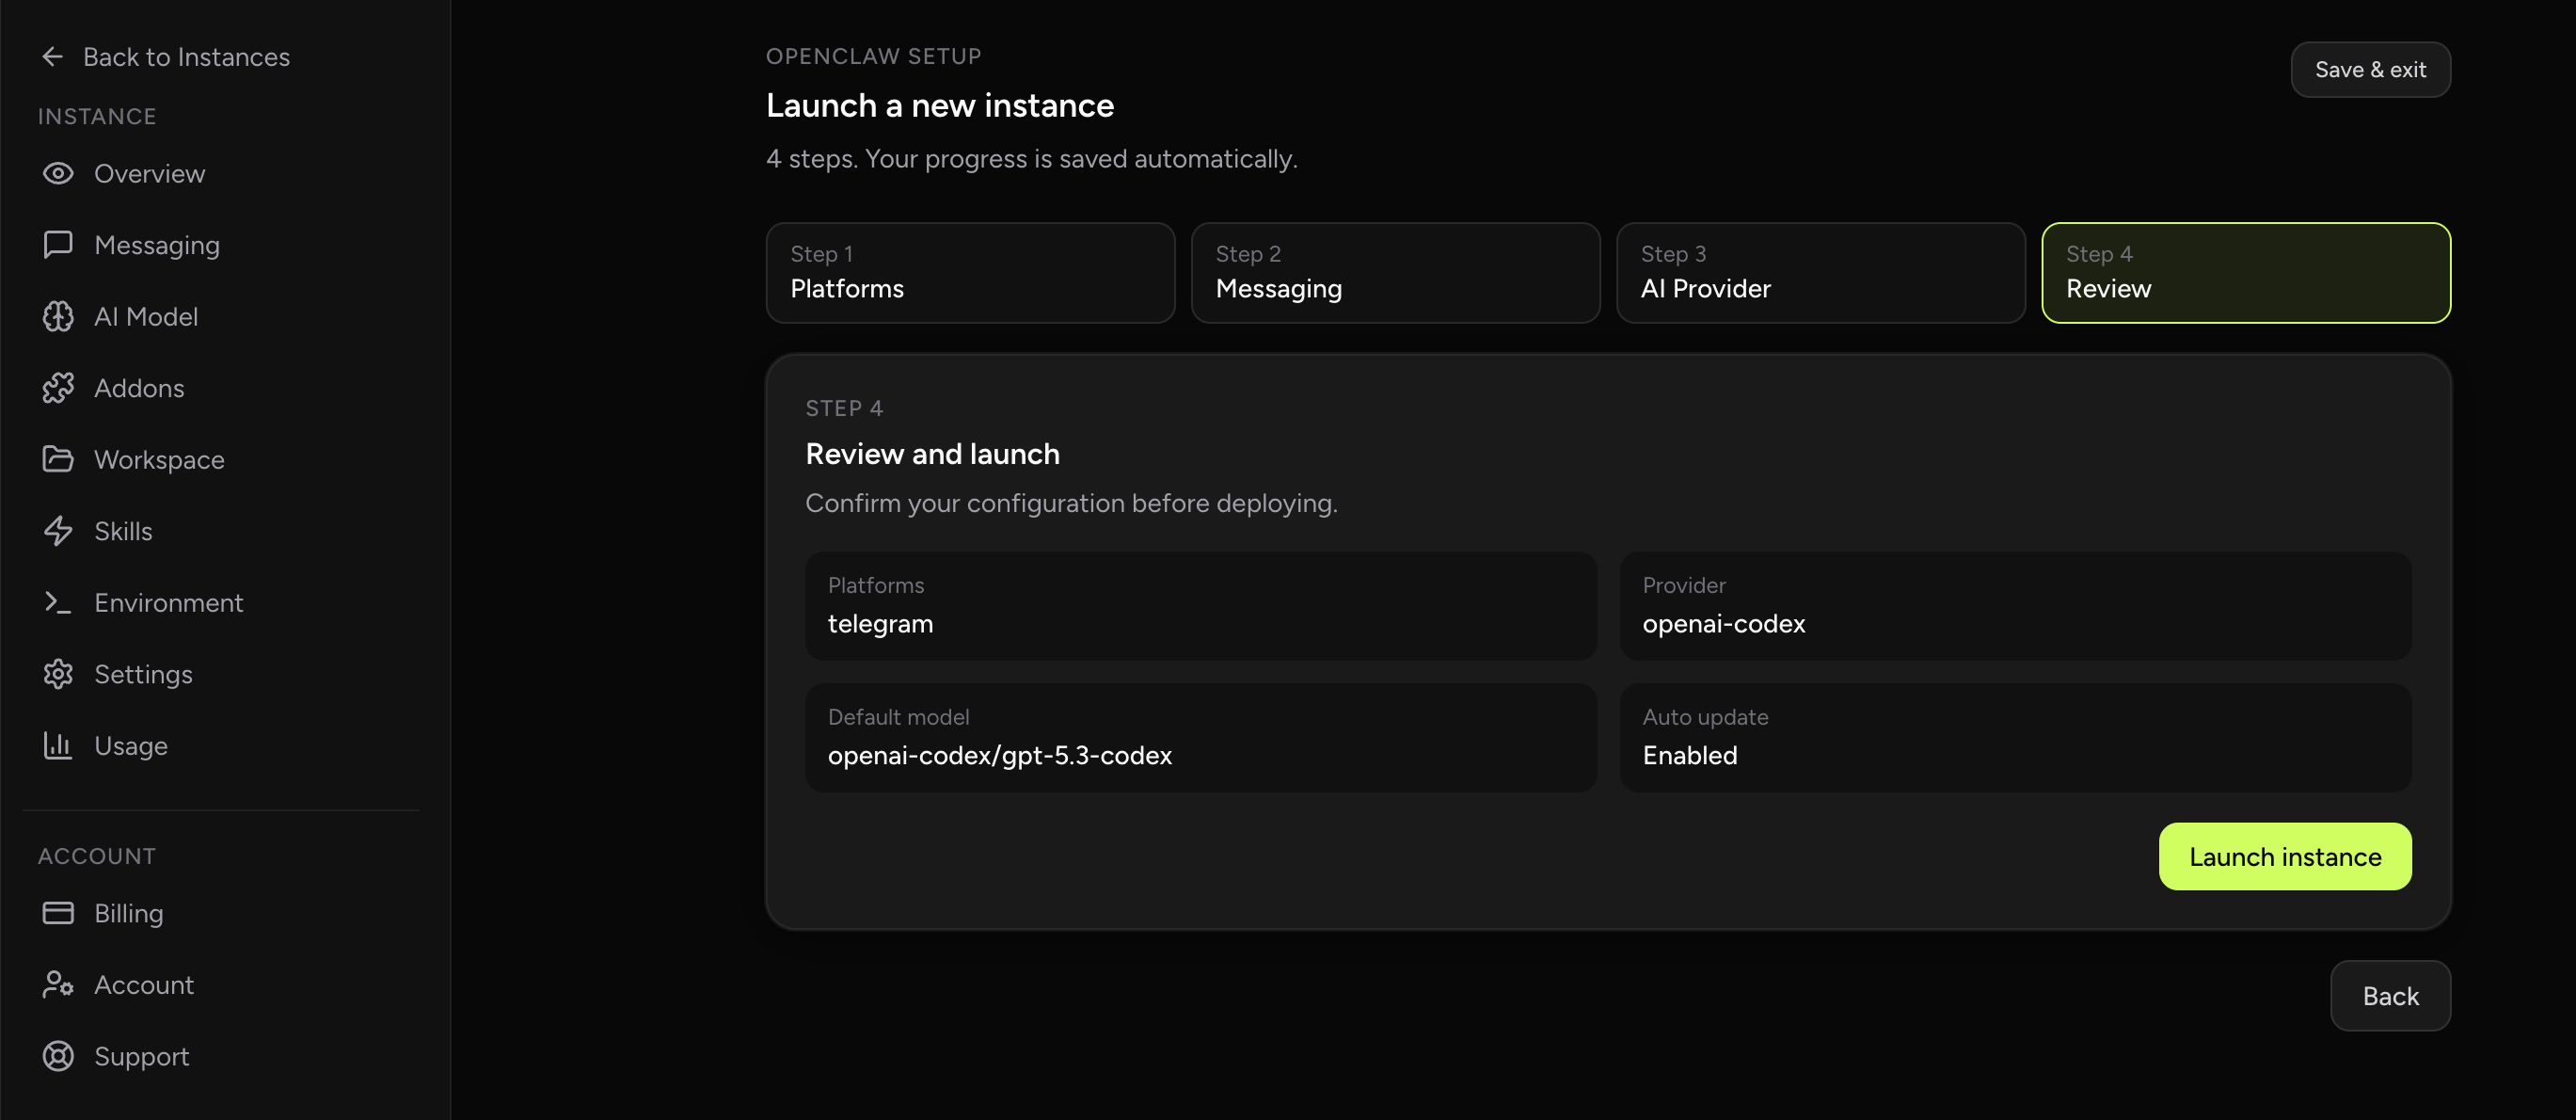
If this keeps coming back, you can move your existing setup to managed OpenClaw cloud hosting instead of rebuilding the same stack. Import your current instance, keep your context, and move onto a runtime with lower ops overhead.
- Import flow in ~1 minute
- Keep your current instance context
- Run with managed security and reliability defaults
If you would rather compare options first, review OpenClaw cloud hosting or see the best OpenClaw hosting options before deciding.
Stop firefighting browser incidents
After recovery, move to productized browser operations: keep instances updated and use Chrome Extension relay when you need actions on real local tabs.
Deep-dive: incident response timeline you can reuse
Teams that recover quickly usually run the same disciplined timeline. In the first 15 minutes, they gather reproducible evidence and prevent panic changes. In the next 30 minutes, they isolate the failing layer with binary checks (works/doesn’t work) instead of “maybe” hypotheses. In the final phase, they stabilize with either a patch, a pin, or a route simplification. You can adopt this exact tempo:
- T+0 to T+15: freeze environment, collect logs, capture failing payload and timestamp.
- T+15 to T+45: compare CLI and tool-path behavior, then split host vs sandbox tests.
- T+45 to T+75: revert to known-good version if regression confirmed; restore service first.
- T+75 to T+120: harden by adding preflight checks and version gate before rollout.
What to log for future forensics
Many postmortems fail because logs miss context. A useful incident bundle should include: gateway start logs, tool invocation payload (with secrets redacted), resolved target/profile values, control-port config, and one successful CLI run for contrast. This lets you compare success path vs failure path directly. If you run multiple environments, include host identity and release channel. The goal is to make tomorrow’s debugging faster than today’s.
How to design a safe rollback policy
Rollback is not failure; it is resilience. Define two explicit rollback triggers: (1) browser status timeout rate above threshold (for example >20% during 10-minute window), and (2) inability to complete one canonical browser workflow. If either trigger fires after a deployment, auto-revert runtime version and config bundle. Keep rollback artifacts immutable, and store the exact pre-change hash so you can return to a known state in minutes rather than hours.
Preventive controls for teams with multiple operators
- Release ring strategy: canary one machine, then small batch, then full rollout.
- Configuration contracts: define allowed target/profile combos for each workflow.
- Automated smoke suite: run browser status + one interaction after each deploy.
- Version observability: always show runtime version in operator dashboard.
- Incident drill: simulate browser timeout monthly so responders stay sharp.
Cost-of-delay math
Suppose one browser-tool incident consumes 90 minutes from two engineers and blocks a customer workflow for half a day. Even at conservative internal rates, this quickly exceeds the monthly difference between self-managed and managed runtime. The point is not “never self-host.” The point is to evaluate reliability work as a real budget line. If you are in a growth phase where shipping speed is decisive, reliability interruptions are expensive technical debt. Use hard data: incidents per month, mean time to restore, and failed automation count. Then decide with numbers, not ideology.
When to escalate upstream
Escalate once you have a minimal reproduction, version fingerprint, and layer isolation result (e.g., “host fails, sandbox passes”). High-quality reports get faster maintainer attention and better fixes. Avoid vague “doesn’t work” posts. Include expected behavior, actual behavior, and why this is operationally critical (blocked onboarding, failed customer automation, etc.). If upstream acknowledges regression, keep your workaround stable and avoid repeated experimental tweaks in production.
FAQ
Can I just increase timeout from 15000ms?
You can, but it usually masks root cause. If URL resolution or target routing is wrong, longer timeout just delays failure.
Should we switch everything to sandbox target?
Not blindly. Pick one model per workload and verify it. Mixing target assumptions without tests increases incident frequency.
What if issue is upstream and no patch yet?
Pin to known-good version, keep minimal repro, and monitor upstream issue. Production stability beats running latest by default.
Final operator reminder: stability comes from repeatable systems, not individual brilliance. If your team can diagnose this failure in one pass and recover without guesswork, you have built a reliable platform—not just patched a bug.