OpenClaw slow gateway after update: event-loop diagnosis and recovery
Problem statement: after an OpenClaw update, the gateway appears alive but feels unusable. First replies take two to five minutes, streams do not become ready for 45 to 120 seconds, the Control UI reconnects, Telegram or WhatsApp delivery lags, idle CPU is unexpectedly high, or ordinary commands wait behind long pauses. This guide gives you a safe recovery path that does not assume every report has the same root cause.
The important distinction is local gateway responsiveness versus remote service latency. A provider can be slow while OpenClaw remains healthy. A network path can be unreliable while the event loop is fine. A cron job, plugin, or browser relay path can also overload the process even when memory looks acceptable. Treat the incident like a timing investigation, not a single magic setting.
- Public reports from May 2026 describe gateway HTTP timeouts while the service stays active with high CPU (#76574), persistent event-loop saturation with temp-file leak and node-list probe timeout (#76047), gateways becoming very slow with CPU pinned at 100% (#76382), and websocket handler CPU-spin starvation on ARM64 (#75703).
- Related reliability reports include doctor --fix failing to resolve multiple issues after upgrade, gateway install crash loops from invalid launch configuration, and earlier update-adjacent latency issues such as #75999 and #75759.
- Operational traces from hosted OpenClaw investigations show a healthy pod and live
/healthendpoint can coexist with channel delivery failures, ACP replay drain timeouts after 5000ms, and completion-announcement retries timing out after 120000ms. That evidence supports timing-by-layer diagnosis instead of relying on a single health check. - In managed-hosting runbooks, the safest recovery pattern is to preserve a last-known-good config snapshot, pause staged upgrades, run channel health checks, and decide between rollback and import only after gateway timing data is captured.
What this failure looks like
A slow gateway incident usually starts with a vague user report: "OpenClaw is broken." The better description is more specific: inbound messages arrive, but the assistant does not start responding quickly; Control UI streams sit idle; channel connectors show typing or reconnect; CPU stays high even with no obvious active task; or a harmless command such as status, config read, or logs follow takes far longer than usual.
These symptoms can share a visible surface while having different causes. An event-loop stall means the Node process cannot quickly service timers, I/O callbacks, websocket frames, and channel sends. Provider latency means the request is out of process and waiting on a model or API. Network latency means packets are delayed, retried, or routed through a slow proxy. A channel delivery issue means Telegram, WhatsApp, or another connector is the bottleneck even if Control UI is fast. Your goal is to separate those paths in under 20 minutes.
Likely causes to separate
- Runtime pressure: the gateway process is busy with retries, file watchers, websocket work, or background jobs.
- Provider latency: the model path is slow even though OpenClaw can receive and route the request.
- Channel delivery delay: Telegram, WhatsApp, or another connector is timing out after the assistant has already generated a reply.
- Update-side drift: a dependency, service file, plugin, or host setting changed during the update and only appears under real traffic.
Immediate rule: freeze further upgrades
When the gateway becomes slow after an update, stop applying more updates. Do not chase nightly builds, dependency bumps, or plugin changes while the incident is active. More changes destroy the timeline. Freeze the version, freeze config, and record the exact time the symptoms started.
- Write down the update time, host, operating system, Node version, and channel paths affected.
- Save the current OpenClaw config and environment variable names, excluding secret values from shared notes.
- Stop non-essential rollout activity for the same team or production channel.
- Pick one test conversation and one channel for reproducible timing.
Step 1: capture baseline logs before restarting
Restarting can temporarily clear pressure and hide the cause. Capture evidence first. You want enough data to answer: did the gateway receive the message quickly, did a session turn begin, did the model call start, did the first token arrive, and did the outbound channel send complete?
# Capture recent gateway and channel errors
openclaw status
openclaw logs --tail 500 | grep -Ei 'error|timeout|gateway|telegram|whatsapp|websocket|stream|provider|cron|plugin'

# If your environment supports it, capture process pressure too
ps -o pid,pcpu,pmem,etime,command -p $(pgrep -f 'openclaw|gateway' | head -n 1)

# Keep a timestamped note beside every test message
# Example: 09:15:22 sent "healthcheck-slow-gateway-001" from Telegram
If logs are huge, do not paste everything into a chat or ticket. Extract the narrow window around one test message and preserve the full file locally. The narrow window gives reviewers signal; the full file lets you re-check assumptions later.
Step 2: separate provider latency from local gateway stalls
Run three tests back-to-back with timestamps. First, send a short prompt from Control UI that requires no tools. Second, send the same prompt from Telegram or WhatsApp. Third, make a direct provider test outside OpenClaw if you have a safe way to do it. The pattern matters more than the absolute number.
- Control UI slow and channel slow: suspect local gateway pressure, provider latency, or shared runtime config.
- Control UI fast and channel slow: focus on channel connector, webhook, polling, proxy, or outbound send.
- Provider direct slow too: do not blame the gateway first; the model path may be the limiting factor.
- Status/config commands slow while no model call is active: local event-loop or process pressure is more likely.
Step 3: check idle CPU and event-loop pressure
High idle CPU after an update is a strong hint that something local is spinning. It might be a retry loop, filesystem watcher, extension relay, browser control path, channel reconnect loop, or cron runner. It might also be expected temporary work after first boot. Measure before deciding.
# Watch whether CPU stays high when no user request is active
ps -eo pid,pcpu,pmem,etime,command | grep -Ei 'openclaw|node|gateway' | grep -v grep

# Check whether a command that should be cheap is delayed
time openclaw status

# Look for repeated reconnects, retries, or cron loops
openclaw logs --tail 1000 | grep -Ei 'retry|reconnect|timeout|cron|watch|loop|backoff|websocket'
A gateway can have acceptable memory and still be unhealthy. Event-loop stalls are about responsiveness, not only memory usage. If cheap commands pause while CPU is high, reduce local work before changing model providers.
Step 4: check command and channel timeouts
Timeouts reveal where the queue backs up. Look for gateway command timeouts, websocket close codes, Telegram or WhatsApp send failures, and stream-ready delays. A 10-second timeout around a channel send means a different thing than a 120-second wait before first model token.
- Mark the inbound timestamp from the user channel.
- Mark when OpenClaw logs the session turn start.
- Mark model request start and first-token time.
- Mark final response and outbound channel delivery.
- Compare the same markers in Control UI and in the channel.
Step 5: test one clean session
Existing sessions can carry heavy context, pending tool calls, file locks, or stale state. Create one clean session and send a short prompt such as "reply with ok and the current time." Disable tool-heavy behavior for that test if your config allows it. If the clean session is fast while the old session is slow, the update may have exposed a session-specific issue rather than a global gateway defect.
Step 6: temporarily reduce heavy cron and plugin paths
Do not delete jobs. Temporarily disable or pause non-critical cron jobs, browser automation loops, large file watchers, experimental plugins, and background workflows that can run without a human noticing. You are looking for a clear before/after timing change.
- Pause high-frequency cron jobs first.
- Pause plugins that poll external services aggressively.
- Pause browser relay work if reconnects are flooding logs.
- Keep one essential communication channel online for validation.
- Document every pause so you can restore the system cleanly.
Step 7: restart after evidence capture
Once you have baseline logs and timing, a controlled restart is reasonable. Restart once, then rerun the exact same tests. Do not combine restart, config edits, provider changes, and channel token changes in one step. If the restart fixes the issue temporarily, monitor whether latency creeps back under load. That pattern points toward a leak, retry storm, or background queue growth.
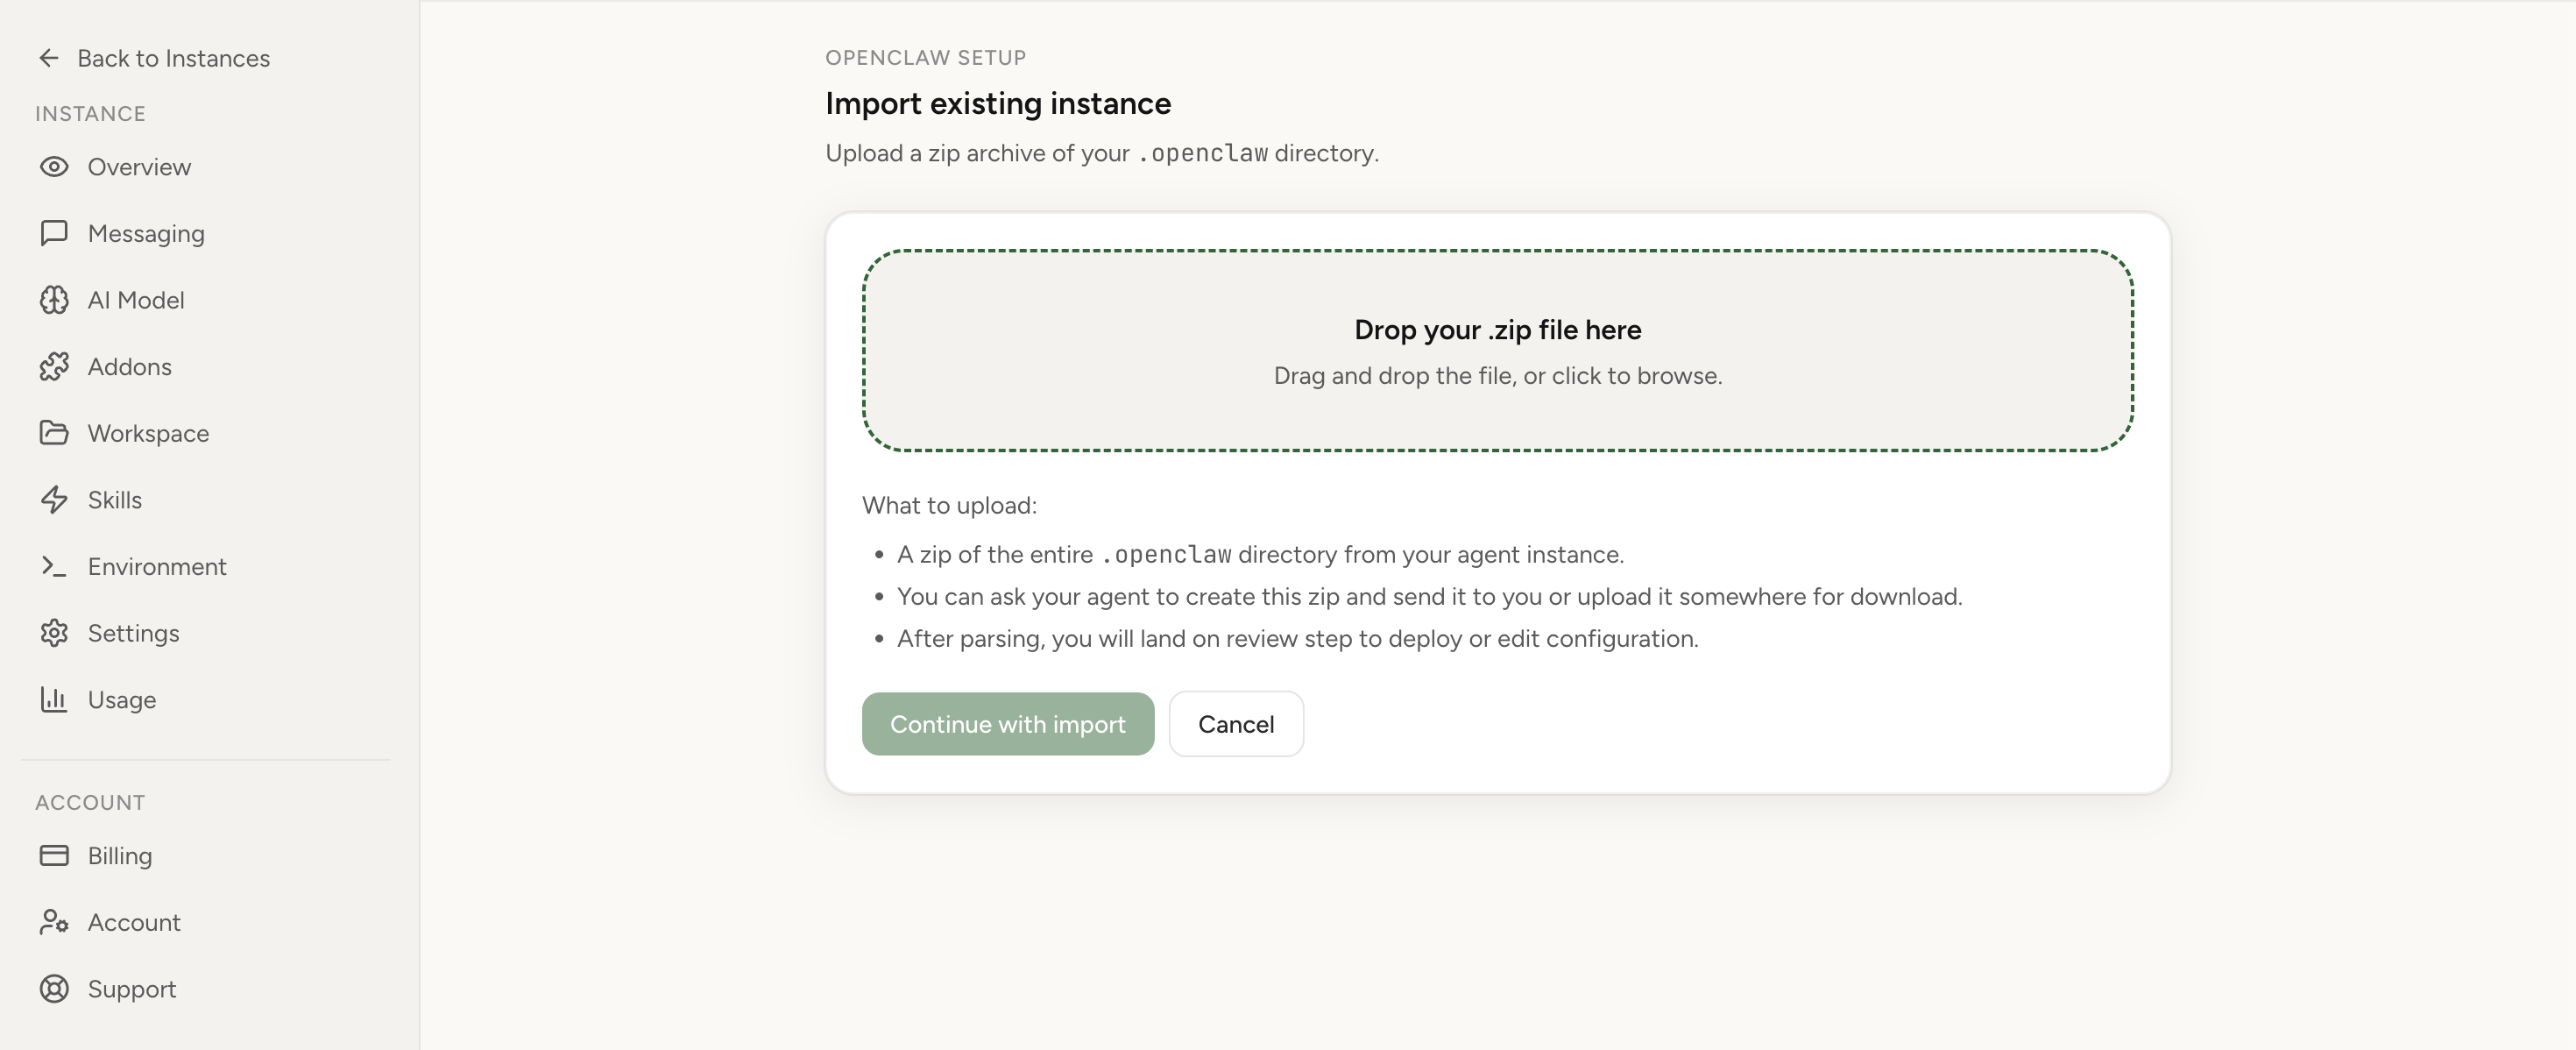
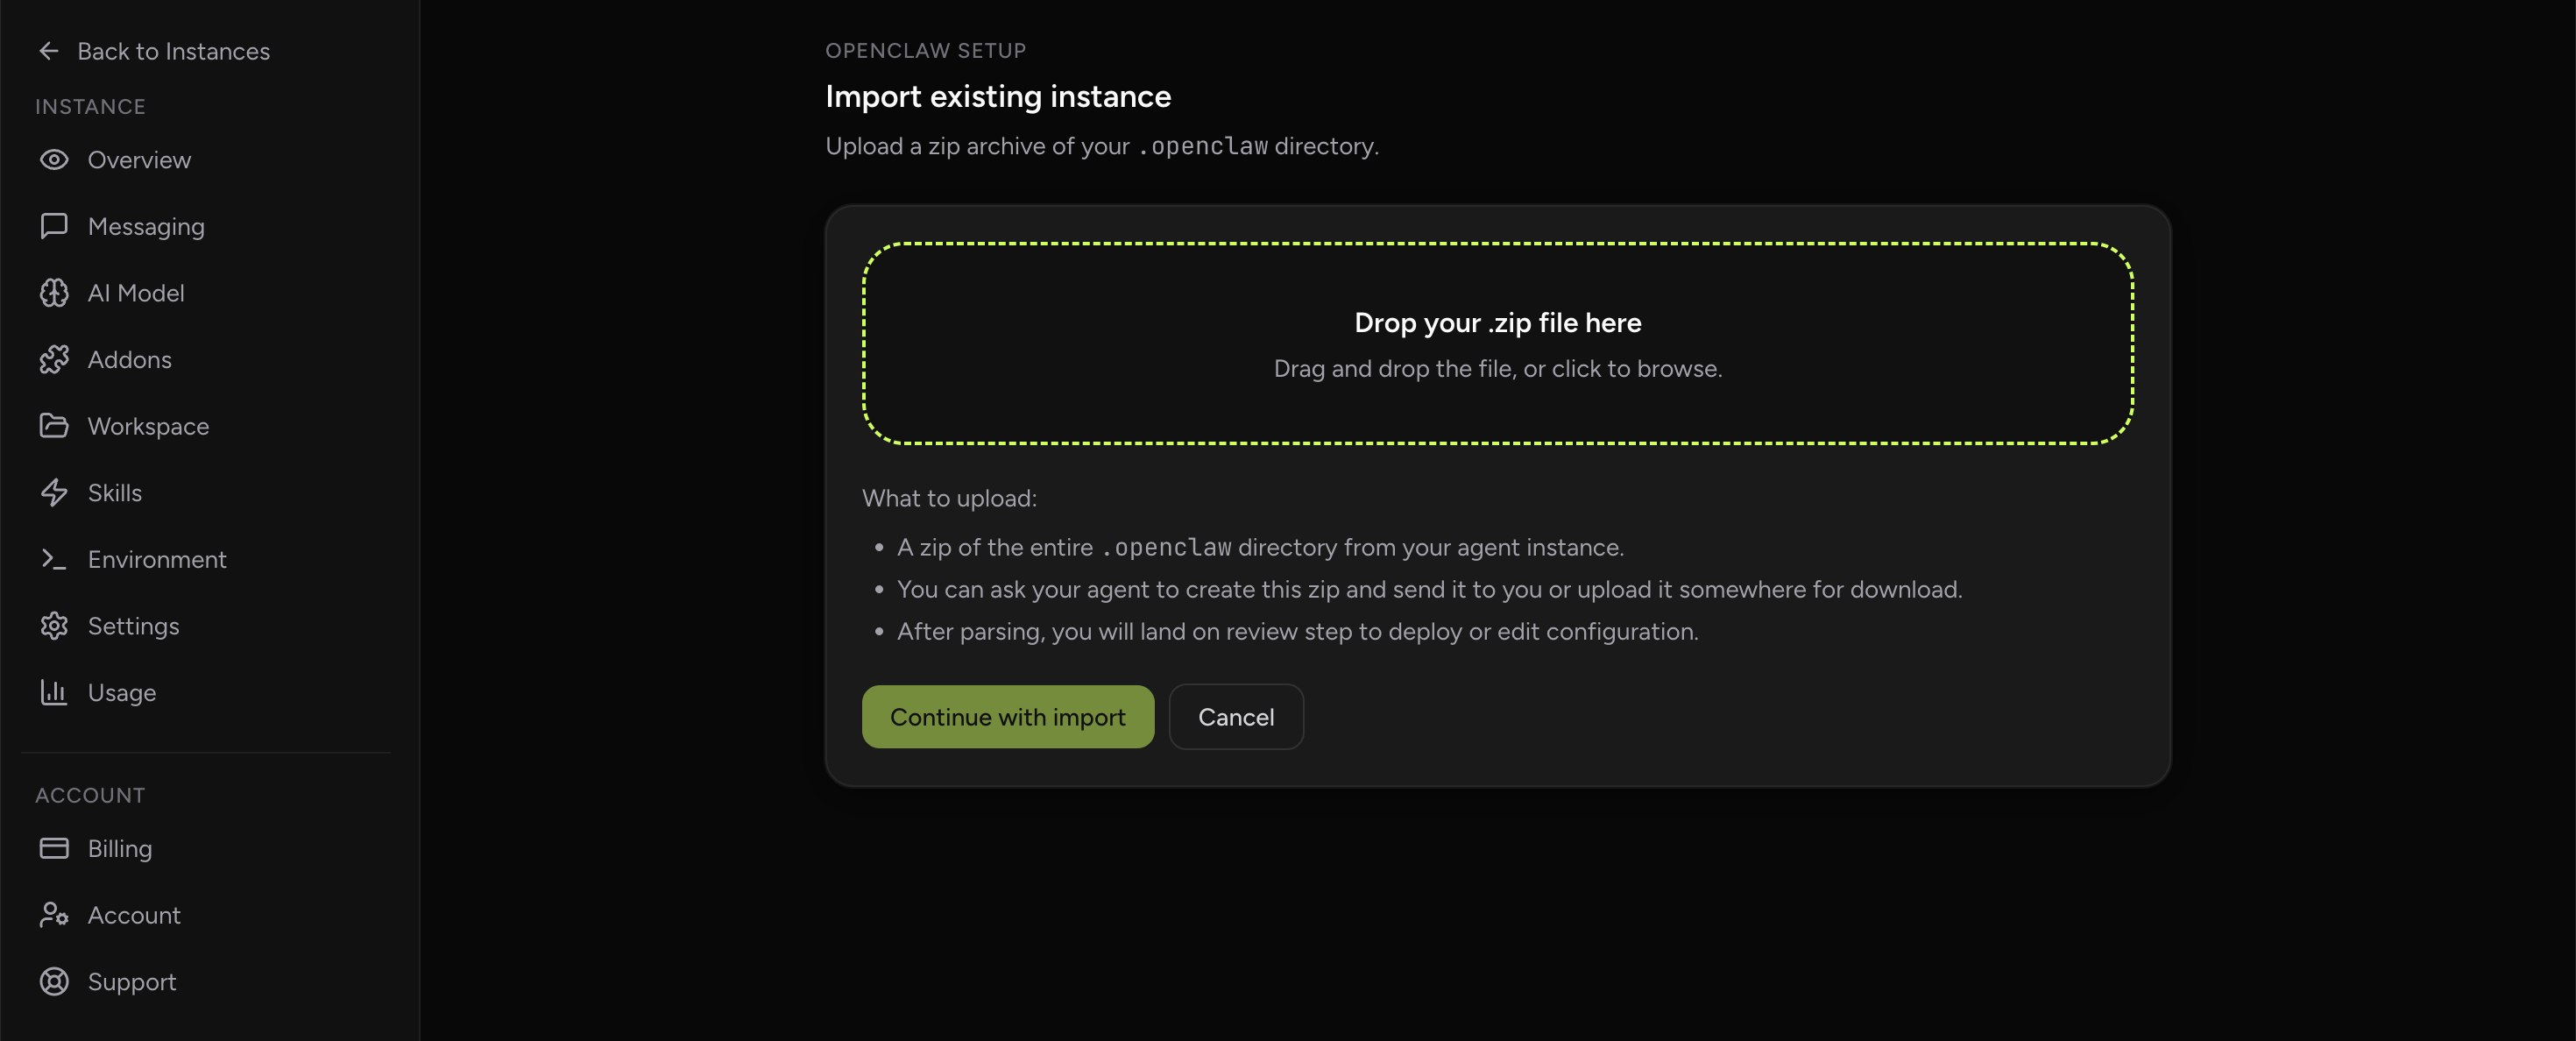
Rollback or import decision gate
If production communications are blocked, do not wait for perfect root cause analysis. Use a decision gate: rollback if you have a known-good local version and config snapshot; import to managed hosting if the host is fragile, the team needs immediate channel reliability, or you cannot safely maintain the update path yourself.
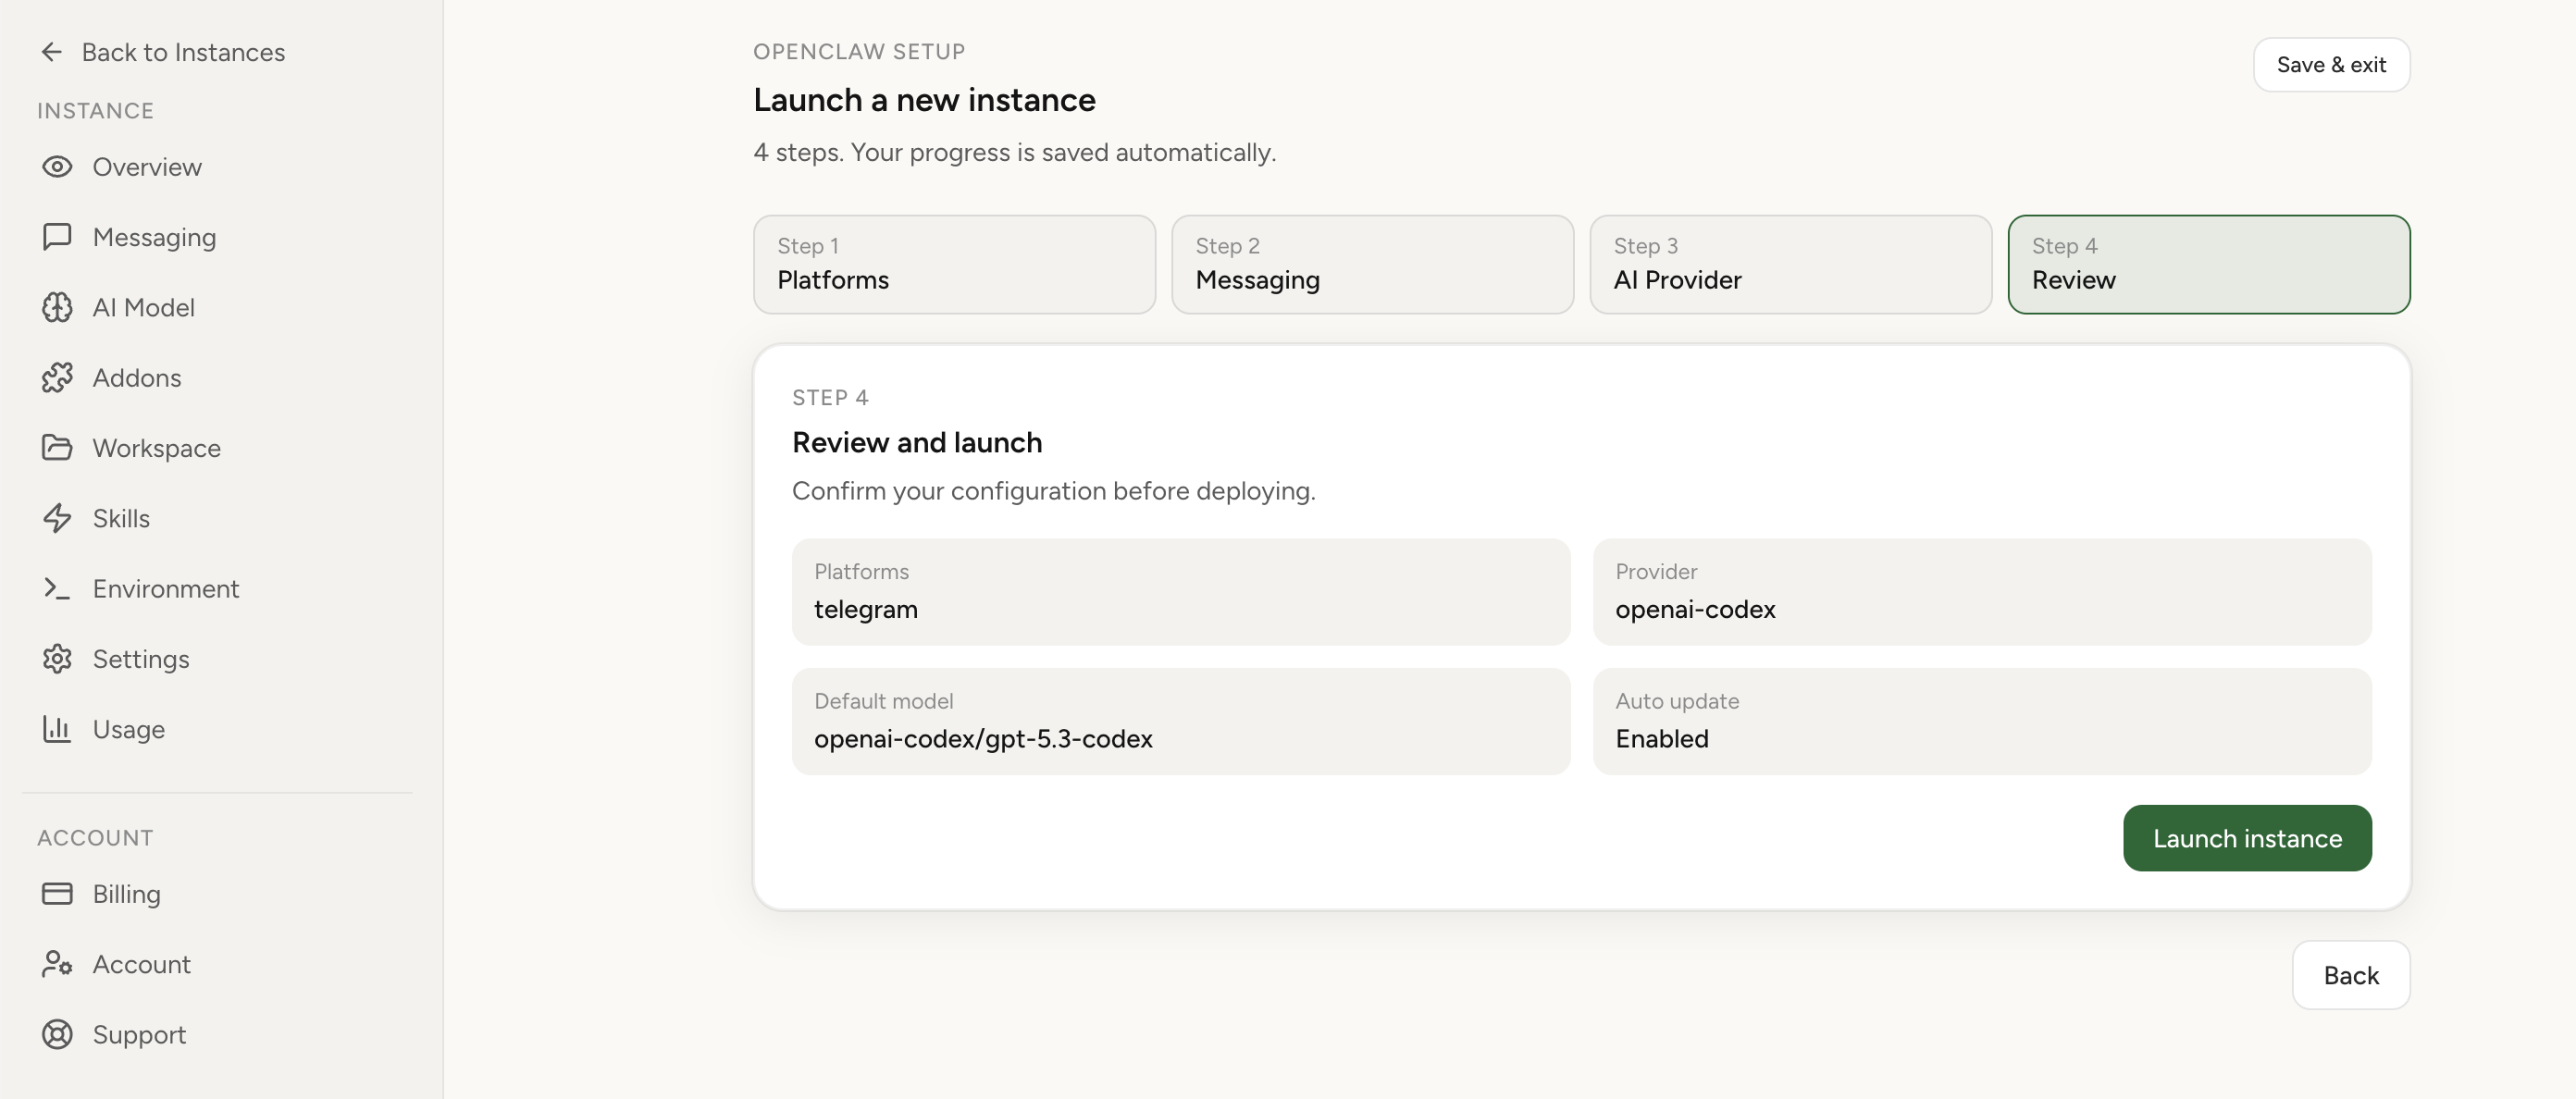
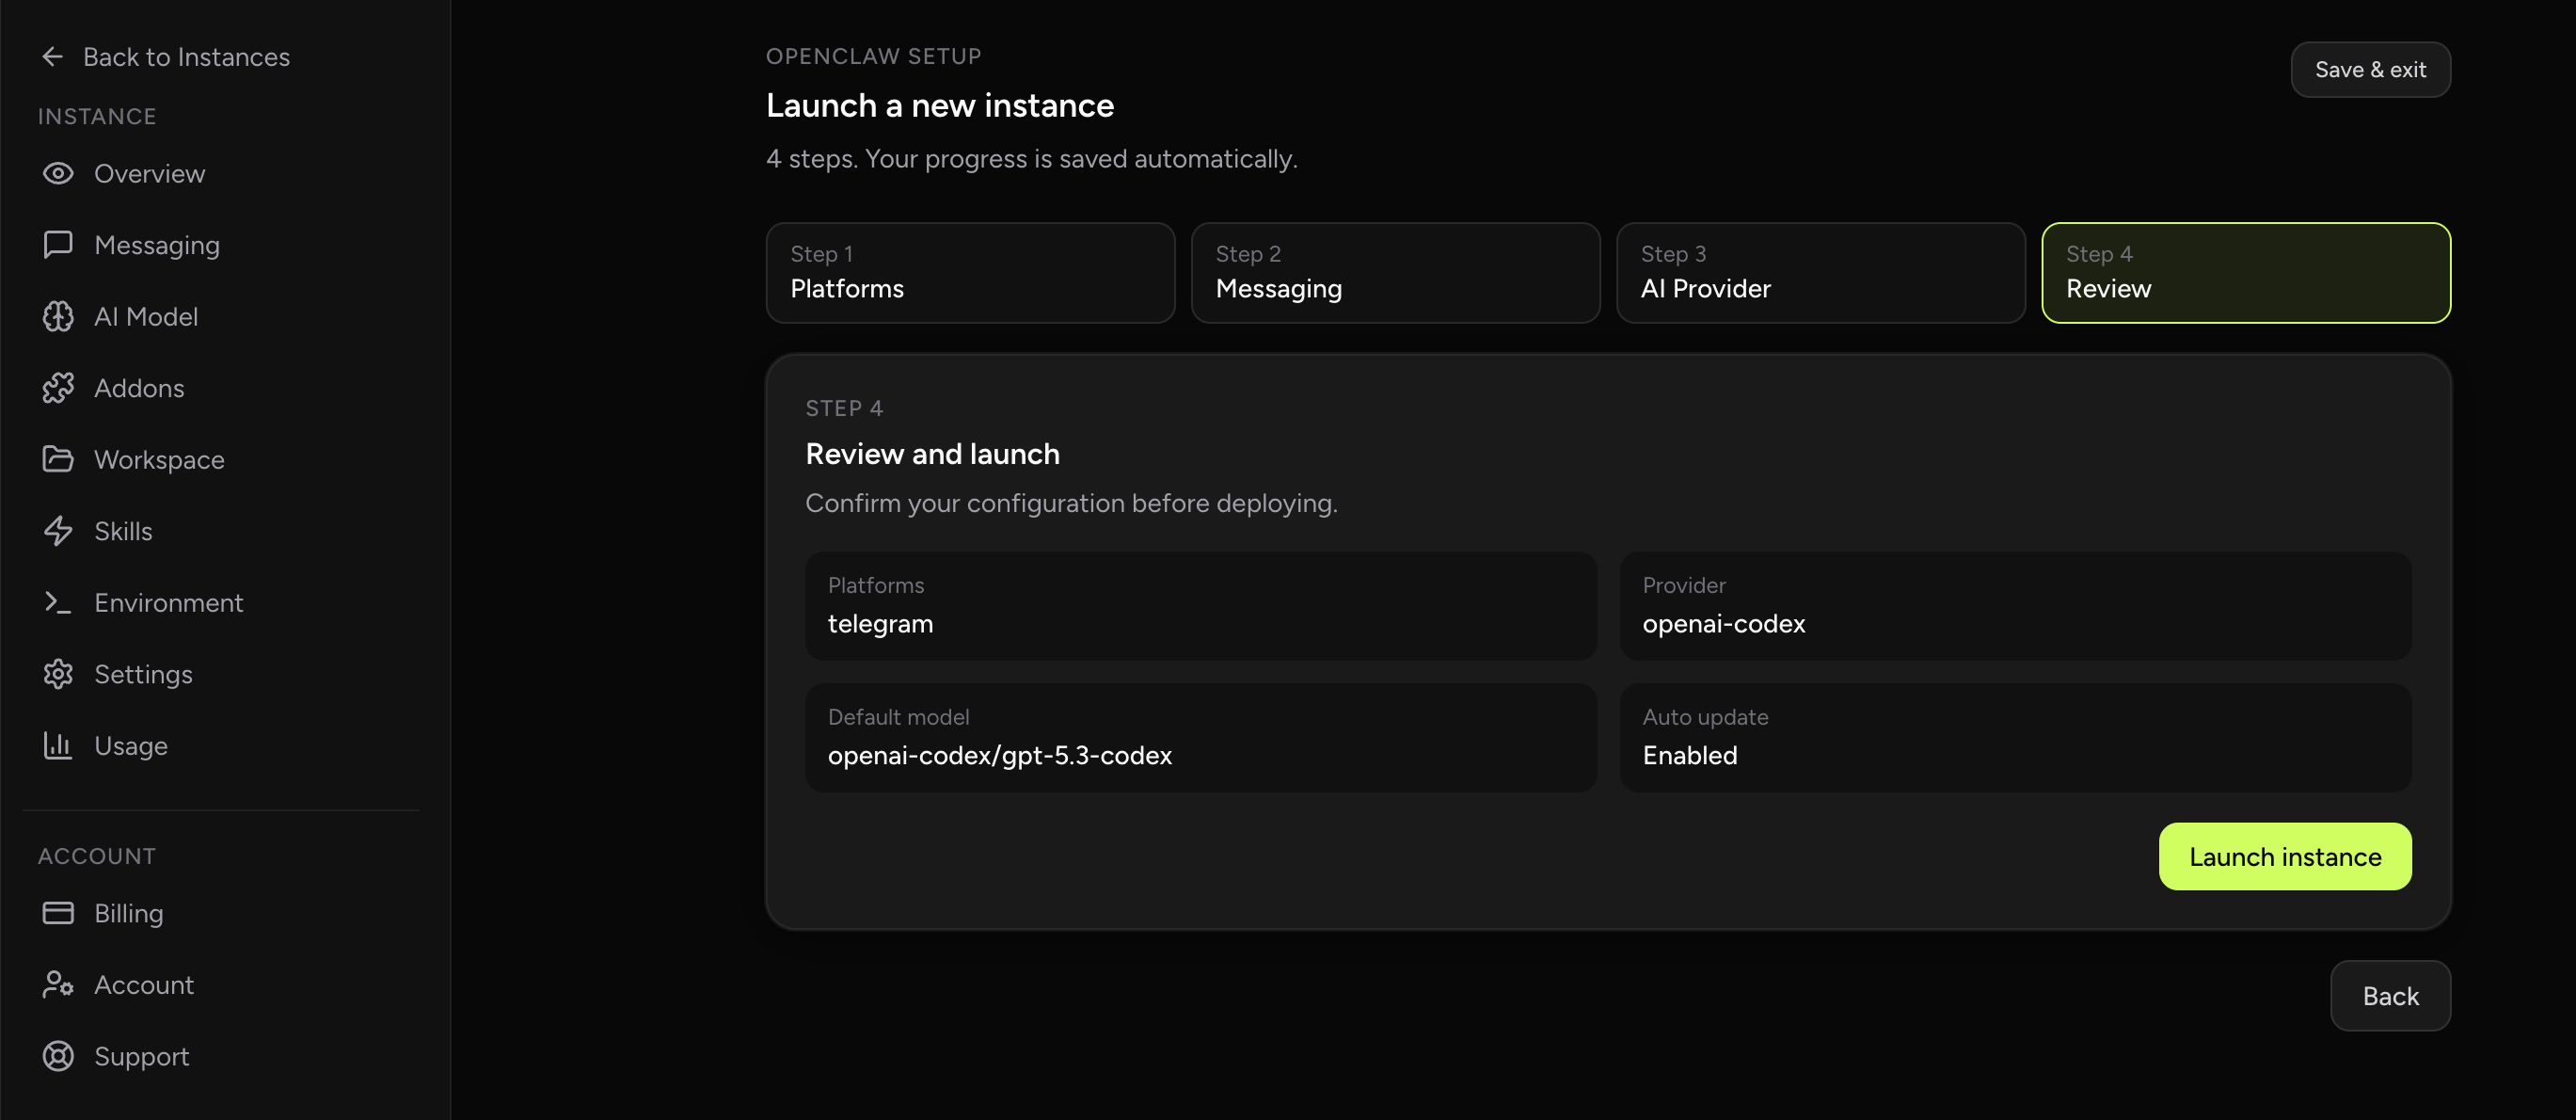
OpenClaw Setup cloud hosting is designed for this operational gap: stable host runtime, channel health checks, rollback/import decisions, and less repeated firefighting around local gateway drift. See OpenClaw cloud hosting if the gateway is tied to business communication and not just a personal experiment.
Fix once. Stop recurring slow gateway recovery.
If this keeps coming back, you can move your existing setup to managed OpenClaw cloud hosting instead of rebuilding the same stack. Import your current instance, keep your context, and move onto a runtime with lower ops overhead.
- Import flow in ~1 minute
- Keep your current instance context
- Run with managed security and reliability defaults
If you would rather compare options first, review OpenClaw cloud hosting or see the best OpenClaw hosting options before deciding.
Edge cases that change the diagnosis
- Only first reply is slow: cold start, provider warmup, context load, or first channel reconnect may dominate.
- Only long conversations are slow: context size, memory reads, or tool history may be the bottleneck.
- Only one channel is slow: inspect connector, proxy, webhook, polling, and provider-specific send limits.
- Only after several hours: suspect accumulating queue pressure, leaked timers, watcher growth, or retry loops.
- Only after enabling browser access: check relay reconnects and browser automation tasks before blaming the model.
Result verification
A fix is not complete when one response appears. Verify both speed and delivery. Use a small matrix and record actual numbers.
- Control UI first-token time under your normal target for three short prompts.
- Stream-ready delay measured and stable across three runs.
- Telegram or WhatsApp message delivered, not only generated in logs.
- Idle CPU returns near expected baseline after requests finish.
- Cheap commands such as status and config reads complete quickly.
- No repeated reconnect, timeout, or retry storm appears in the next log window.
Typical mistakes
- Restarting immediately and losing the only useful evidence.
- Changing model provider, Node runtime, channel token, and plugins at the same time.
- Assuming every post-update slowdown is the same bug.
- Ignoring idle CPU because memory usage looks normal.
- Testing only Control UI when the outage affects Telegram or WhatsApp users.
- Restoring every cron job at once after a temporary improvement.
FAQ
Can an update make OpenClaw slow without fully crashing?
Yes. A process can remain alive while the event loop is overloaded or while channel sends queue behind slow work. That is why reconnects, stream delays, and command latency matter as much as uptime.
Is high idle CPU always an OpenClaw bug?
No. It can come from a plugin, watcher, browser relay path, cron job, bad network retry, or host-level process. Start with evidence and reduce local pressure step by step.
Should I downgrade immediately?
Downgrade when production use is blocked and you have a known-good rollback path. If you do not have a clean rollback path, capture evidence, reduce load, and consider importing to a managed runtime instead of improvising on a broken host.
What is the fastest safe test after recovery?
Send one short prompt through Control UI and one through the affected channel, then compare first-token time, stream-ready time, and final delivery. Repeat three times before declaring the incident closed.
Related reading: compare deployment tradeoffs at /compare/, review the hosted runtime at /openclaw-cloud-hosting/, keep the self-hosted baseline at /openclaw-setup/, and use Chrome Extension relay when browser access needs safer separation from the gateway host.